Building Custom Dashboards with Linbis API: Your Freight Data, Your Interface 🧩📊

Why Build a Custom Freight Dashboard? 📦📈
Most software shows you some data. But custom dashboards give you full control:
- 🔍 Show only what matters: ETA, mode, delays, last updates
- 👥 Segment views by user roles or departments
- 🧾 Combine shipments, invoices, and documents in one screen
- 🚨 Highlight exceptions or overdue tasks
- 🌐 Embed live status for clients in your portal
With Linbis API, you get raw access to the data—you decide how it’s visualized.
Getting Started: What You Need 🧰
To follow this tutorial, you’ll need:
- React + Vite or CRA (Create React App)
- Axios or Fetch API client
- Your Linbis API key
- Basic knowledge of React components and hooks
✅ Prefer Vue or Angular? The concept still applies—you just replace the framework.

Step 1: Authenticate and Fetch Freight Data 🔐
Start by requesting your shipment list:
javascript
CopiarEditar
import axios from ‘axios’;
const API_KEY = ‘YOUR_API_KEY’;
export const fetchShipments = async () => {
const res = await axios.get(‘https://api.linbis.com/v1/shipments’, {
headers: {
Authorization: `Bearer ${API_KEY}`
}
});
return res.data;
};
Use useEffect() to fetch on component mount and store in state:
javascript
CopiarEditar
useEffect(() => {
fetchShipments().then(setShipments);
}, []);
Step 2: Create Dashboard Layout with Cards 🧩
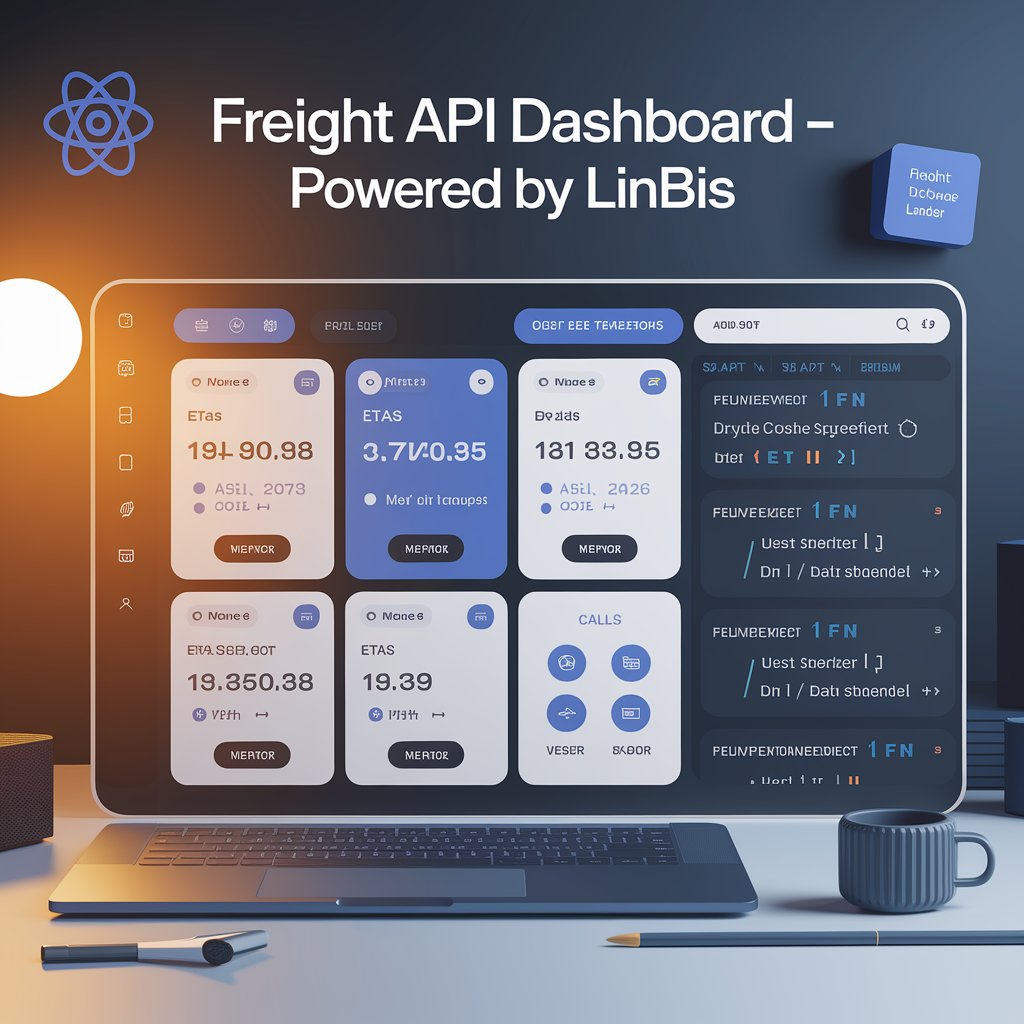
Here’s a simple dashboard layout using React:
jsx
CopiarEditar
const Dashboard = ({ shipments }) => (
<div className=”grid grid-cols-3 gap-4″>
{shipments.map(s => (
<div key={s.id} className=”p-4 border rounded shadow”>
<h3>{s.reference}</h3>
<p>Status: {s.status}</p>
<p>ETA: {s.eta}</p>
<p>Mode: {s.mode}</p>
</div>
))}
</div>
);
🎨 Style it using TailwindCSS, Bootstrap, or your own branding.

Step 3: Add Filters, Sorting, and Alerts 🔄
Make your dashboard dynamic:
- ⏳ Filter by status (In Transit, Delivered, Delayed)
- 📅 Sort by ETA or creation date
- 🚨 Highlight late shipments in red
- 📍 Add clickable rows for shipment detail view
Example filter logic:
jsx
CopiarEditar
const delayed = shipments.filter(s => s.status === ‘Delayed’);
Step 4: Make It Client-Ready 🌐
- Use a secure login to show filtered dashboards per client
- Embed the dashboard in your Linbis-powered portal
- Add export to PDF or CSV options
- Use webhooks to refresh data in real time without polling
Your dashboard can be as simple—or as advanced—as your team needs.

Sample Project on GitHub 🚀
To save you time, we’ve published a ready-to-use React freight API dashboard example on GitHub.
🔗 GitHub repo: github.com/linbis/freight-dashboard-react
It includes:
- Auth setup
- Dashboard layout
- Shipment filtering
- Status colors and icons
- Responsive UI
Fork it, clone it, and customize it to your operations.
Build Smarter, Not Slower
With the freight API dashboard approach, you control the experience—internally and externally. Stop adapting your workflow to rigid software. Build your own interface using Linbis data, and scale your visibility with zero limits.
👉 View code and start building your freight dashboard today.
