Real-Time Cargo Analytics: Smarter Freight Decisions with Linbis

Introduction
That’s why Linbis developed real-time cargo analytics — a cloud-based intelligence layer that transforms live transport data into actionable insights. With AI-driven dashboards, predictive models, and automation, Linbis gives logistics teams the tools to make faster, smarter, and more profitable decisions.
Step 1: Centralize Live Cargo Data
Linbis integrates real-time data from every part of the supply chain:
- Carrier APIs: live shipment location, ETA, and route changes.
- IoT sensors: temperature, humidity, vibration, and geolocation.
- Warehouse and port systems: cargo handoff and dwell time data.
- ERP and TMS platforms: order details, invoices, and customer data.
- External feeds: weather, customs, and port congestion updates.
This unified view ensures that every stakeholder — from forwarders to clients — sees exactly what’s happening across all shipments, in real time.
Step 2: AI-Powered Analytics and Predictions
Linbis uses artificial intelligence to process cargo data continuously and identify performance trends:
- Predicts delivery delays before they occur.
- Detects bottlenecks in routes, ports, or warehouses.
- Analyzes carrier reliability and lane efficiency.
- Forecasts demand surges or shipment volume increases.
AI transforms raw transport data into precise, predictive intelligence that logistics managers can act on immediately.

Step 3: Dynamic Dashboards and Visualization
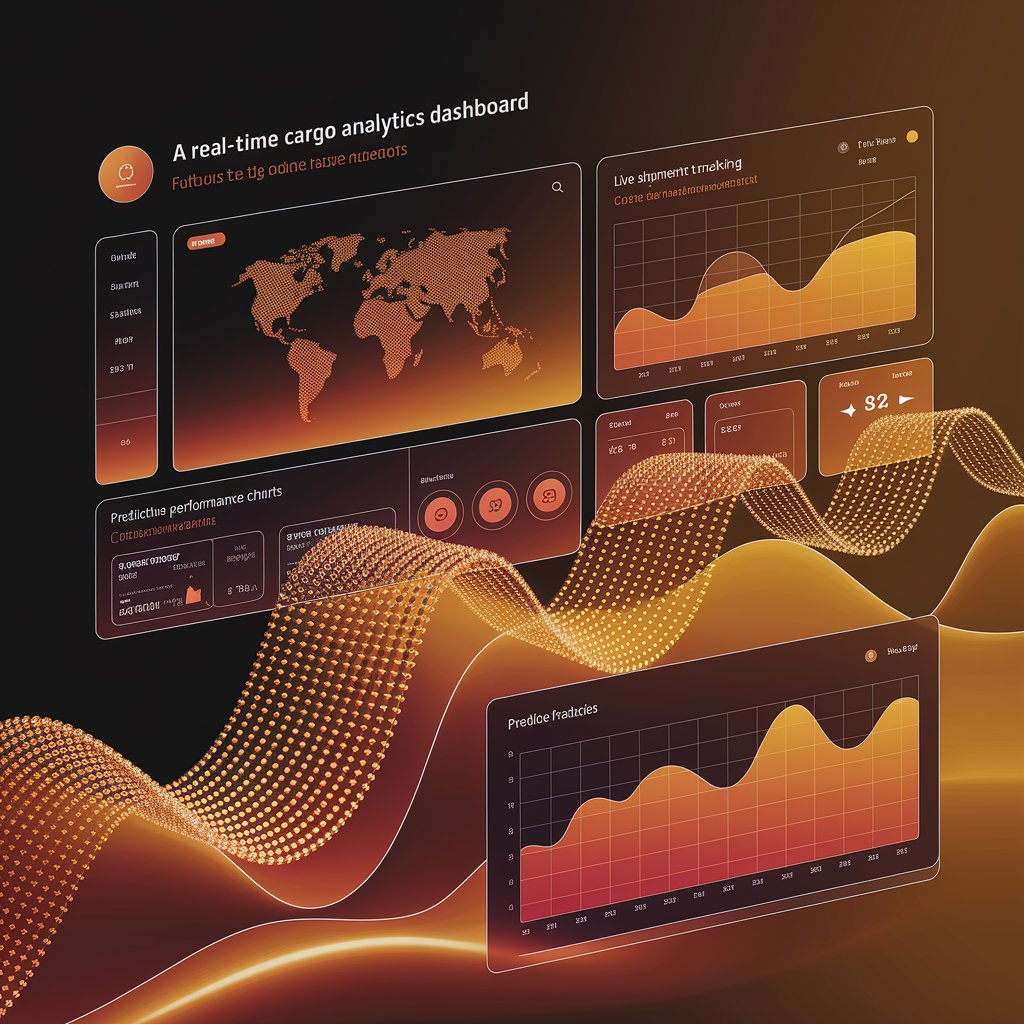
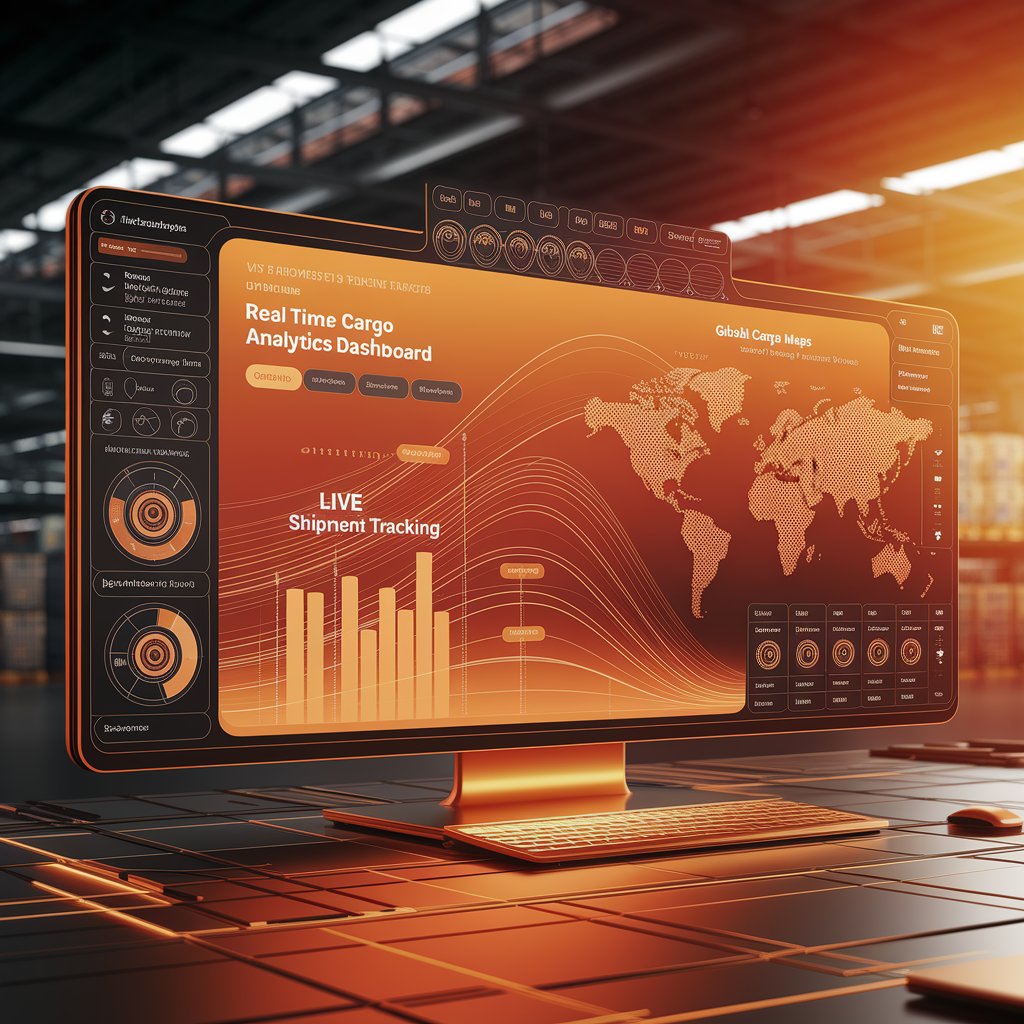
The Linbis dashboard provides an interactive, real-time view of all logistics operations:
- Global map showing cargo positions and predictive ETAs.
- Performance KPIs by carrier, mode, or region.
- Automated alerts for route deviations or cargo exceptions.
- Comparative analytics for cost, transit time, and reliability.
Every widget is customizable, so operations, finance, and customer service teams can track what matters most.
Step 4: Automated Decision Support
Real-time analytics are directly linked to Linbis automation workflows:
- If cargo delay detected, notify customer automatically.
- If temperature exceeds threshold, trigger alert to cold-chain team.
- If route efficiency drops, suggest re-routing or carrier change.
- If delivery confirmed, auto-generate proof and invoice.
This turns Linbis from a passive dashboard into an active logistics command center.
Step 5: Continuous Learning and Optimization
Every shipment helps Linbis improve through machine learning:
- Refines predictive ETA accuracy.
- Learns optimal lane combinations.
- Detects recurring inefficiencies.
- Suggests process automation for repetitive issues.
The system evolves with every transaction, ensuring stronger insights and smoother operations over time.

Advanced Features
- Predictive analytics engine with AI forecasting.
- Multi-modal cargo visibility (air, sea, rail, road).
- Exception management automation.
- Role-based dashboards for different departments.
- Sustainability metrics tracking CO₂ emissions per shipment.
Real-World Example 🚛
A freight forwarder in Rotterdam adopted Linbis real-time cargo analytics to track cross-border shipments. In 3 months:
- Reduced transit delays by 23%.
- Increased carrier reliability by 18%.
- Cut manual tracking work by 70%.
Now, their entire operations team monitors live performance through predictive dashboards that recommend actions automatically.

Benefits 📈
- Visibility: Track shipments live across all carriers.
- Proactivity: Detect issues before they cause disruption.
- Efficiency: Automate alerts, actions, and documentation.
- Profitability: Optimize transport routes and carrier performance.
- Sustainability: Monitor environmental impact in real time.
Conclusion
With real-time cargo analytics, Linbis brings logistics visibility into the AI era.
It doesn’t just show where cargo is — it predicts where it’s going, how it’s performing, and what can be improved instantly.
Linbis transforms logistics data into a strategic advantage, giving freight companies total control, agility, and intelligence across their operations.
