Smart Supply Dashboards: Turning Data into Decisions with Linbis
Introduction
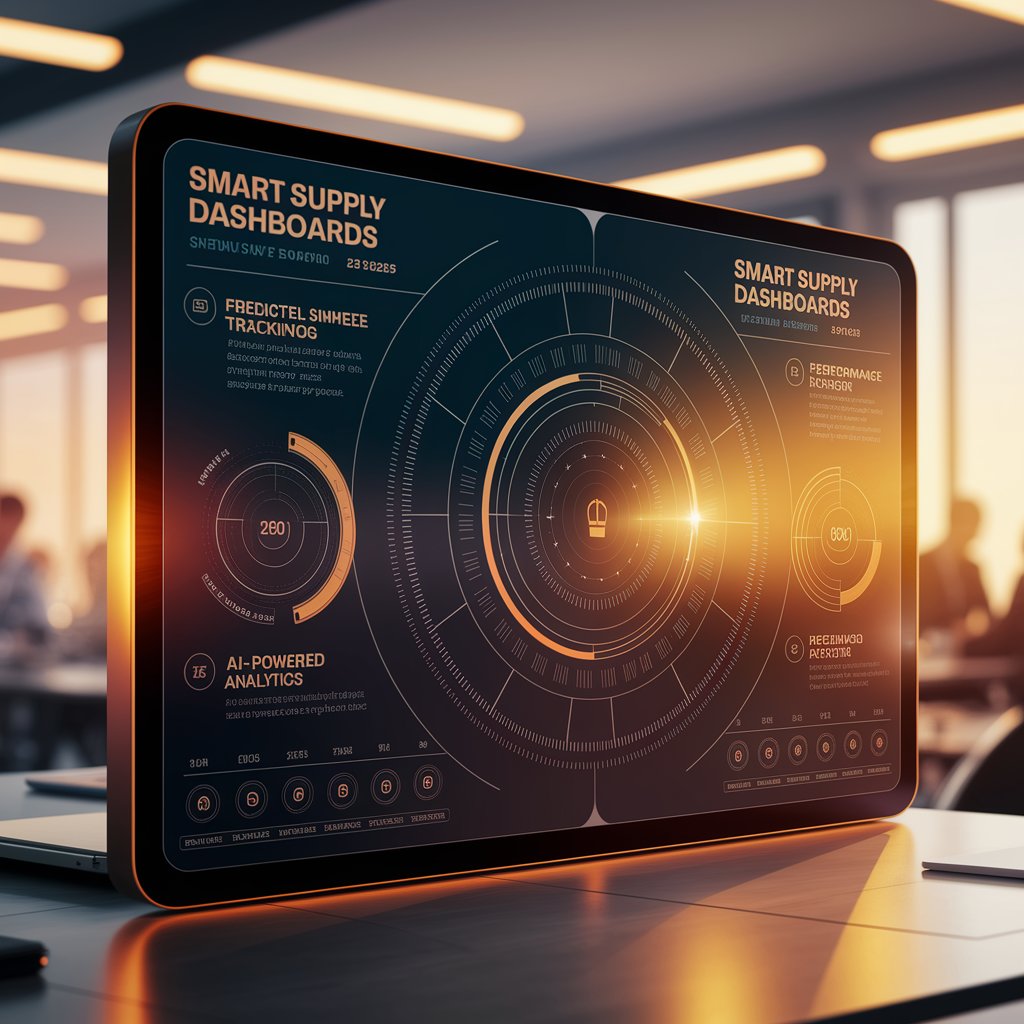
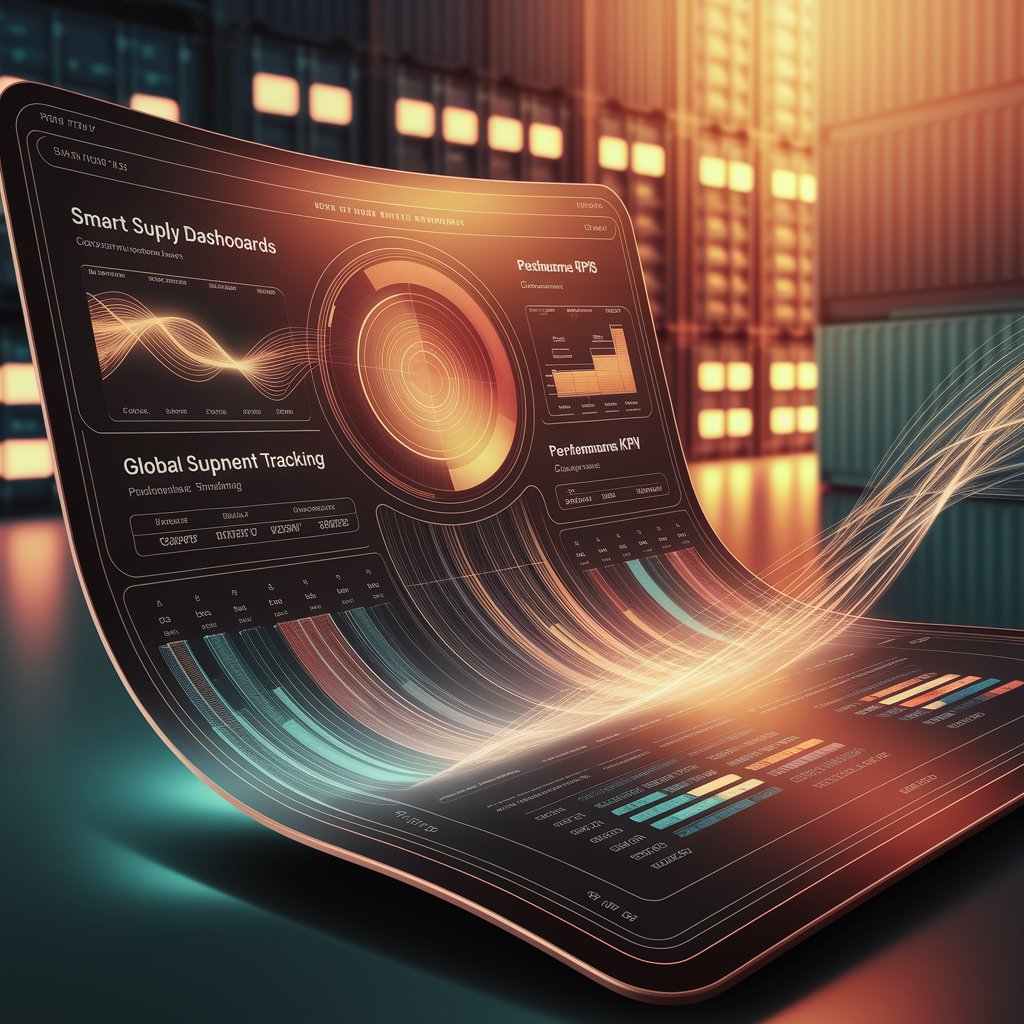
Smart supply dashboards from Linbis change that. Powered by real-time data and artificial intelligence, these dashboards deliver actionable insights across the entire supply chain — from inventory levels to transport performance — helping logistics professionals make faster, smarter, and more profitable decisions.
Step 1: Centralize Supply Chain Data
Linbis integrates and synchronizes data from all operational systems into one intelligent interface:
- TMS (Transportation Management System): Live shipment tracking, ETAs, and carrier performance.
- WMS (Warehouse Management System): Inventory, order fulfillment, and labor efficiency.
- ERP: Billing, margins, and cost allocation.
- External data feeds: Weather, fuel rates, port congestion, and customs updates.
By unifying every layer of the supply chain, Linbis ensures a single source of truth for real-time visibility.
Step 2: AI-Powered Visualization
Smart supply dashboards go beyond numbers — they think and adapt:
- Predict order demand and material shortages.
- Forecast delays and potential disruptions.
- Highlight cost-saving opportunities automatically.
- Visualize KPI trends across lanes, carriers, and clients.
Every chart, map, and alert is dynamically updated, helping teams focus on what matters most right now.
Step 3: Customizable Views for Every Role
Linbis dashboards adapt to each department’s needs:
- Operations: Real-time shipment and inventory status.
- Finance: Freight cost tracking, margin analysis, and billing accuracy.
- Sales: Customer satisfaction metrics and order volume forecasts.
- Management: Strategic KPIs, SLA compliance, and predictive performance analytics.
Each user can build their own dashboard view, ensuring insights align with responsibilities.
Step 4: Predictive Alerts and Automation
The AI engine inside Linbis continuously monitors supply chain activity to trigger automated actions:
- If inventory drops below forecasted threshold, alert procurement.
- If shipment delay probability > 70%, reassign carrier automatically.
- If cost per lane rises, suggest optimization or alternate routes.
- If customer SLA risk detected, notify account manager instantly.
This automation transforms dashboards from passive displays into active command centers.
Step 5: Continuous Optimization and Learning
- AI refines predictive models based on operational data.
- Dashboards evolve as user interactions reveal new priorities.
- Performance benchmarks are updated automatically by region or client.
- Insights grow sharper over time, improving long-term strategy.
The result: smarter forecasting, smoother coordination, and lower operational costs.

Advanced Features
- Drag-and-drop dashboard builder for easy customization.
- Predictive widgets with real-time forecasting visuals.
- Automated KPI tracking for cost, time, and service performance.
- Cross-platform integration with all major logistics tools.
- Carbon emission tracking for sustainable logistics planning.
Real-World Example 🚛
A logistics provider in Los Angeles implemented Linbis smart supply dashboards to unify data from five separate systems. Within 4 months:
- Reduced reporting time by 80%.
- Improved on-time delivery by 22%.
- Identified over $95,000/year in freight cost inefficiencies.
Now, management and operations teams collaborate in real time — with one dashboard showing the entire supply chain performance.

Benefits 📈
- Visibility: Complete real-time view of supply operations.
- Efficiency: Eliminate manual reporting delays.
- Agility: Predict and resolve issues before they escalate.
- Accuracy: Reliable data across departments and systems.
- Scalability: Adapt dashboards as your business grows.
Conclusion
With smart supply dashboards, Linbis transforms complex logistics data into real-time intelligence. Predictive analytics, AI alerts, and automated workflows allow logistics providers to move from reactive management to proactive strategy.
The result is a supply chain that thinks for itself — efficient, connected, and ready for the future.