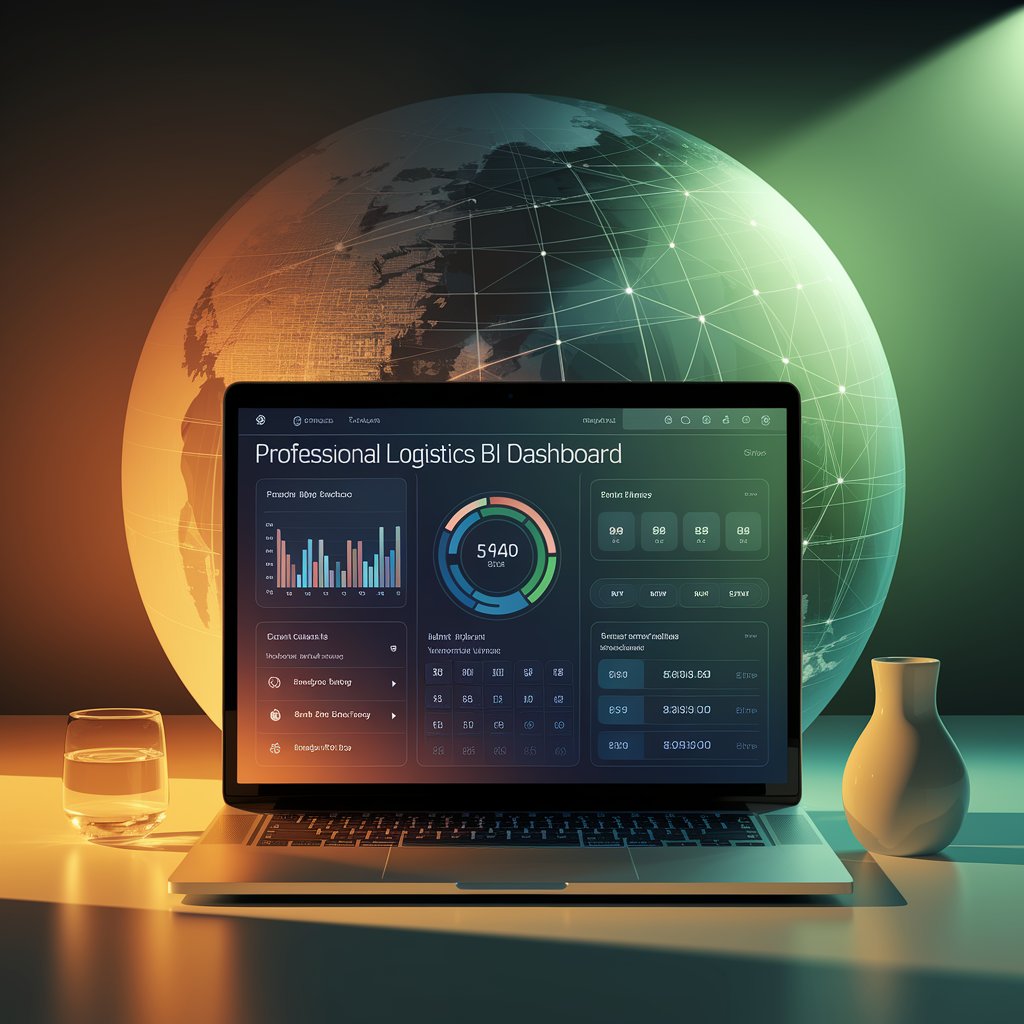
Logistics BI Dashboards: Unlocking Data-Driven Supply Chains

Introduction
That’s where logistics BI dashboards come in. Business Intelligence (BI) dashboards turn raw logistics data into meaningful insights, empowering managers and teams to make faster, smarter, and more strategic decisions.
What Are Logistics BI Dashboards?
An interactive data visualization tool that aggregates information from multiple systems such as TMS, WMS, ERP, and IoT devices. Instead of relying on static spreadsheets, companies can view dynamic, real-time dashboards that display KPIs and trends across the entire supply chain.
Key features include:
- Customizable KPI tracking
- Real-time data visualization
- Drill-down analysis by mode, region, or shipment
- AI-powered predictive insights
- Automated reporting for management

Benefits of Logistics BI Dashboards
Benefit | Business Impact |
Enhanced Visibility | End-to-end supply chain transparency |
Faster Decisions | Real-time alerts for disruption management |
Cost Optimization | Identify inefficiencies and reduce spend |
Customer Satisfaction | Improve service with accurate updates |
Scalability | Support growth with flexible, cloud-based tools |
How They Work in Practice
- Data Integration: Pulls from ERP, TMS, CRM, and IoT sources.
- Processing & Cleaning: Ensures data accuracy and consistency.
- Visualization: Displays KPIs through charts, maps, and graphs.
- Predictive Modeling: Uses AI to forecast demand and risks.
- Reporting: Provides automated reports for executives and partners.

Use Cases Across Logistics
- Freight Forwarders: Monitor carrier performance and automate cost reporting.
- Warehousing: Track space utilization, throughput, and inventory turnover.
- Transportation: Optimize routes and monitor fuel consumption.
- Customer Service: Provide accurate ETAs with live dashboard integration.
Why BI Dashboards Are a Must-Have
In an industry defined by speed and complexity, logistics BI dashboards enable businesses to stay ahead of challenges. Instead of reacting after the fact, companies can proactively manage risks, optimize costs, and continuously improve service delivery.

Conclusion
Logistics BI dashboards transform raw data into actionable insights, driving efficiency, transparency, and smarter decision-making across supply chains. Companies that implement BI dashboards gain a competitive edge by leveraging predictive analytics and real-time visibility. For forward-thinking logistics providers, these dashboards are no longer optional—they’re a strategic necessity.
